Available on every plan · Updated 12 September 2026
Also asked as: “export my sales to csv” · “report says available on the professional plan” · “how far back do reports go” · “sales by customer report” · “download orders as a spreadsheet”
Analytics → Reports is a library of ready-made tables. Each one answers a single question over a date range you choose, adds a total row, and on the plans that include it, downloads as a CSV you can open in a spreadsheet.
Every plan can open Reports. What differs is how many of the tables you can run, how far back they reach, and whether you can export them.
The library
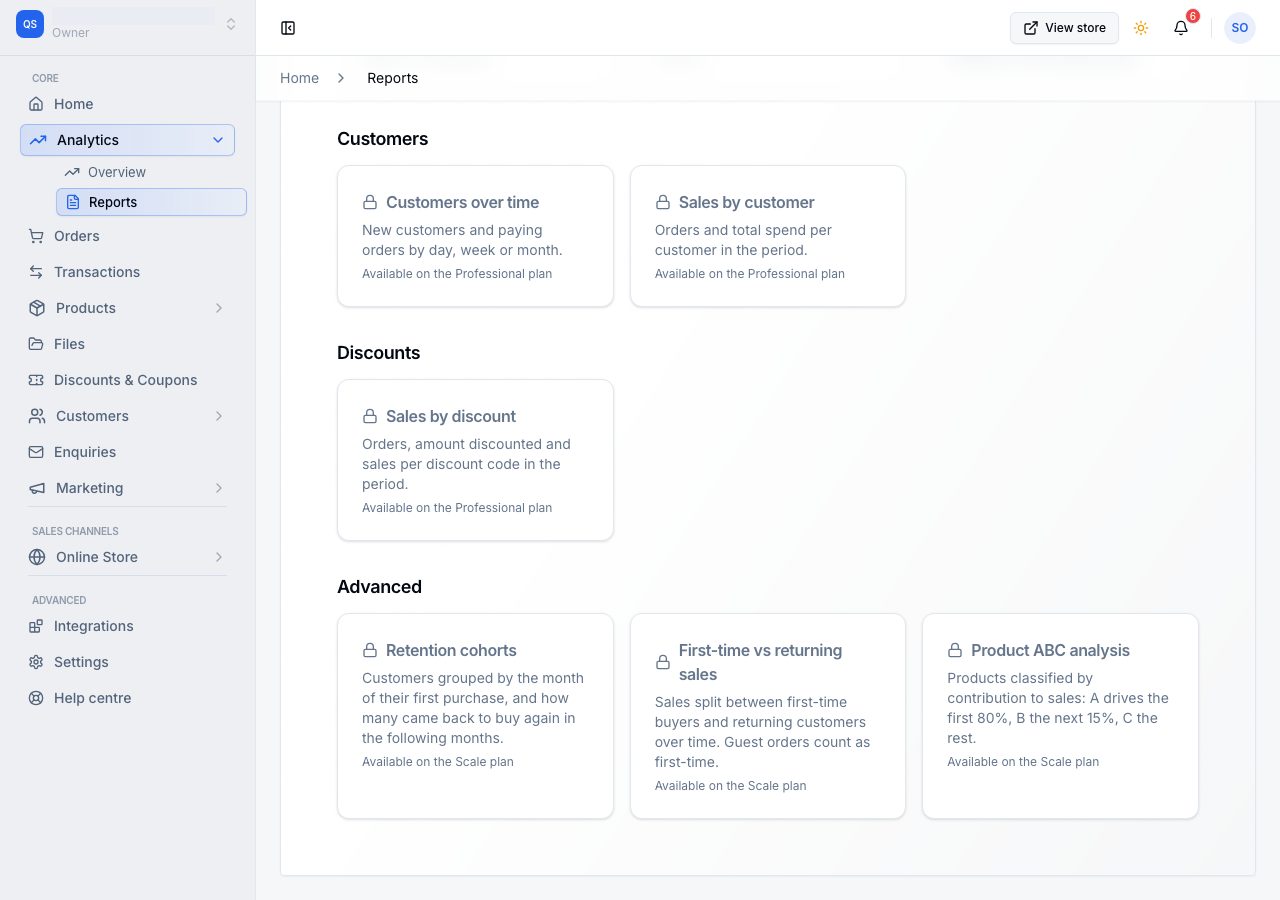
The catalog groups the reports the way you would go looking for them.
- Sales: sales over time, by product, by variant, by location and by channel.
- Finances: a finance summary, tax collected, and payments by method.
- Customers: customers over time, and sales by customer.
- Discounts: sales by discount code.
- Advanced: retention cohorts, first-time against returning sales, and an ABC analysis that sorts your products by how much of your sales they carry.
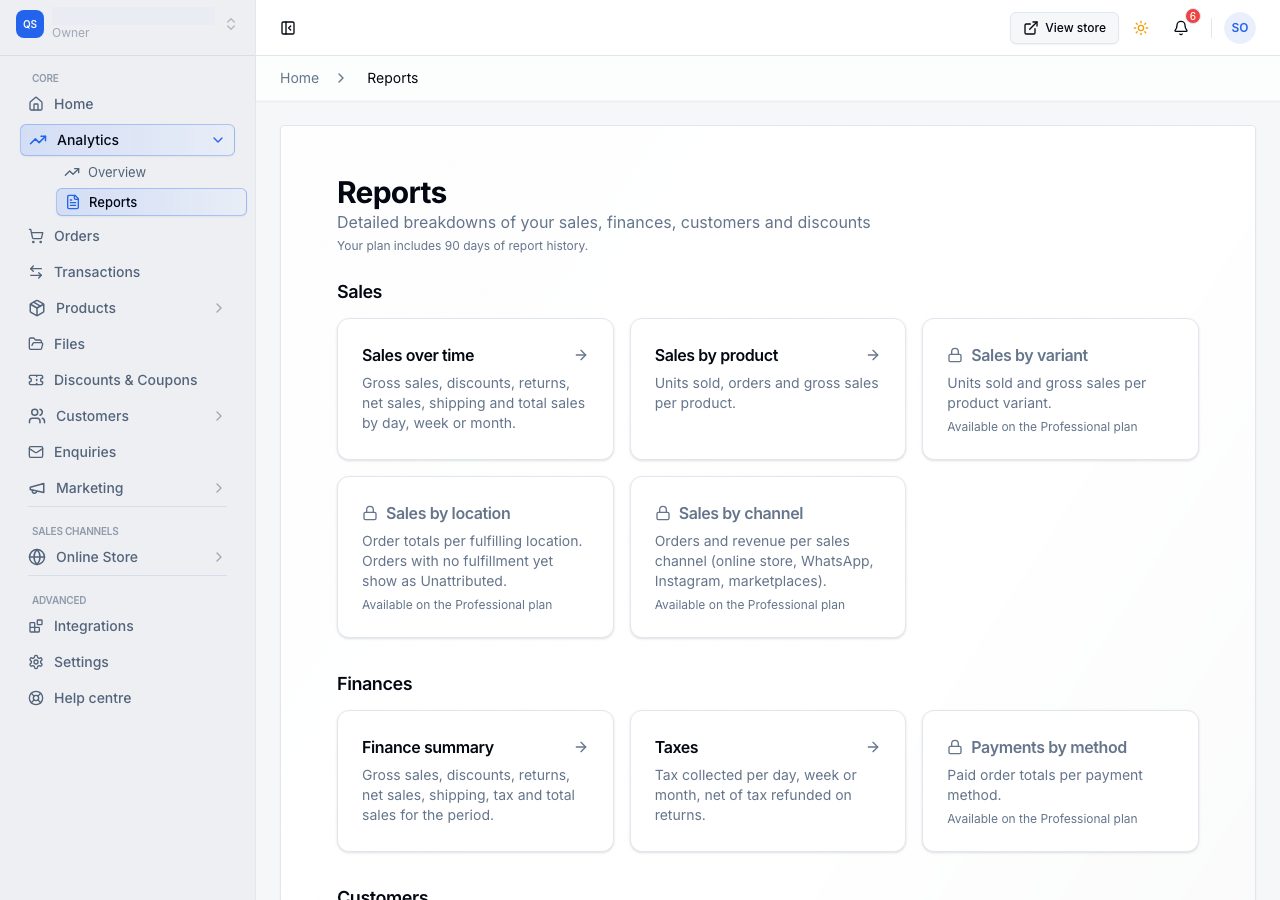
A report your plan does not include still appears, with a small padlock and the plan that unlocks it, so you can see what is there before you decide to pay for it. Choosing it opens the same page with an Upgrade plan button instead of a table.
What is in each plan
The tiers and what each costs are on the pricing page. For reports:
| What you get | |
|---|---|
| Every plan | Sales over time, sales by product, the finance summary and the tax report, over your plan's history window. |
| Professional | The rest of the standard library (by variant, by location, by channel, by payment method, by customer, by discount code, and customers over time), a longer history window, and CSV export everywhere. |
| Scale | The Advanced group, and history that is not cut off at all. |
How far back the history goes
Each plan reaches back a set distance, and your Reports page prints yours in one line under the heading. Starter reaches back months, Professional reaches back a year, and Scale is not limited. The exact windows sit beside the plans on the pricing page.
The window is not only about Reports. It also decides which ranges the Analytics pages will accept, which is why a range reaching further back than your plan allows is greyed out in the date menu and marked "(upgrade)".
Nothing is deleted when a window ends. The orders, customers and money are all still yours; a shorter window means the reporting screens will not reach past it until you move up a plan.
Running one
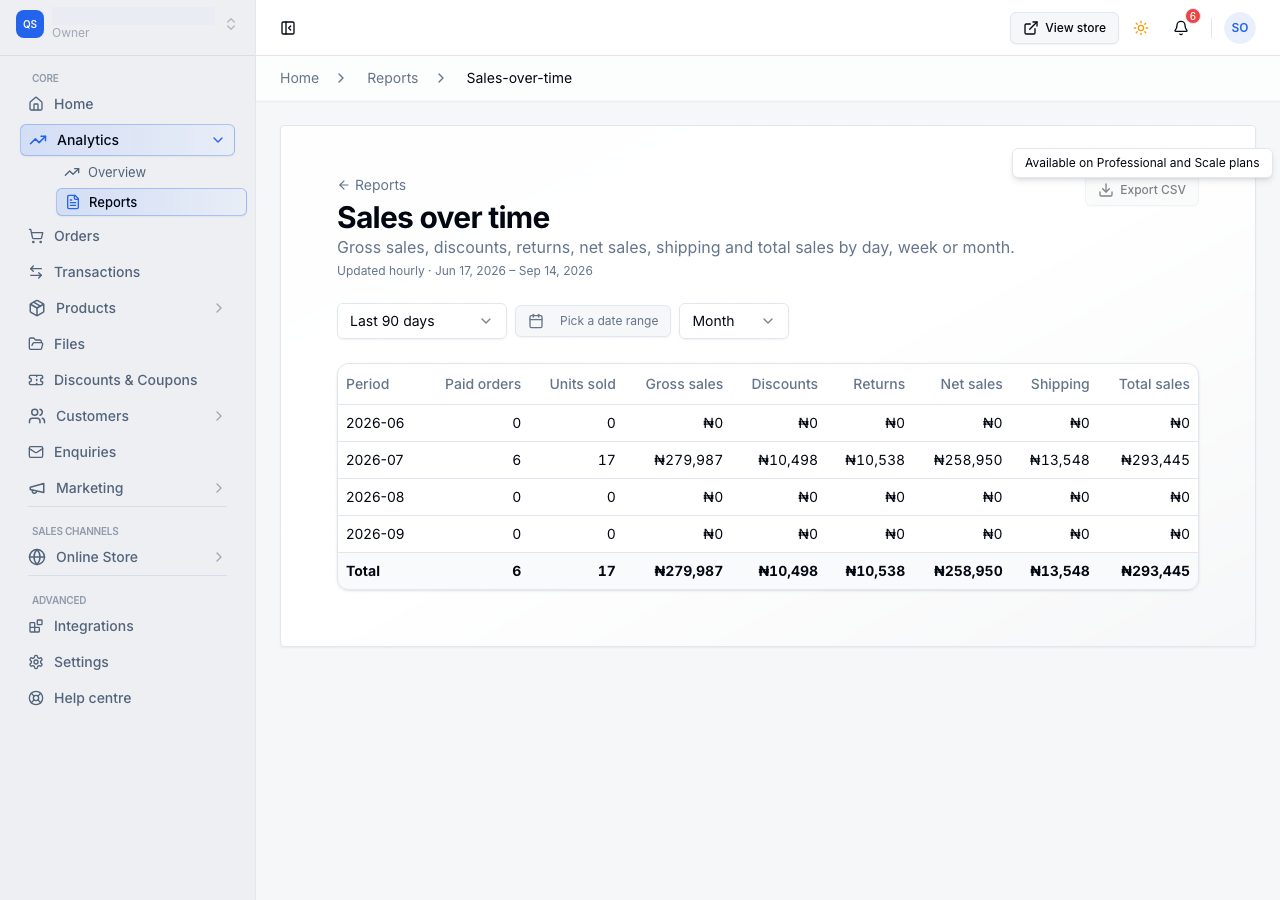
Open any report and you get the same controls: the date range, Pick a date range for two dates of your own, and on the reports that cover a stretch of time, a Day, Week or Month switch. The line under the title says when the figures were last rebuilt and which dates you are looking at.
The bottom row of the table is the total for the range, which is the figure to read if you only want one number.
Exporting
Export CSV downloads exactly the report on screen, for exactly the range you chose. It is included on Professional and Scale. On Starter the button is there but will not press, and resting on it says which plans include it.
The reports that list one row per customer, variant or discount code stop at a thousand rows, and say so underneath when they do. Their total row adds up the rows shown, so narrow the date range if you need a whole period counted.
Two more exports follow the same rule and the same button: the Export on your Orders list, and the one on your Customers list.
The figures underneath
Reports are rebuilt every hour from your orders and refunds, which is what lets them cover long ranges quickly. The Analytics pages are worked out as you open them. So on a busy day the two can differ by about an hour's trading, and the line under a report's title says when it was last rebuilt.
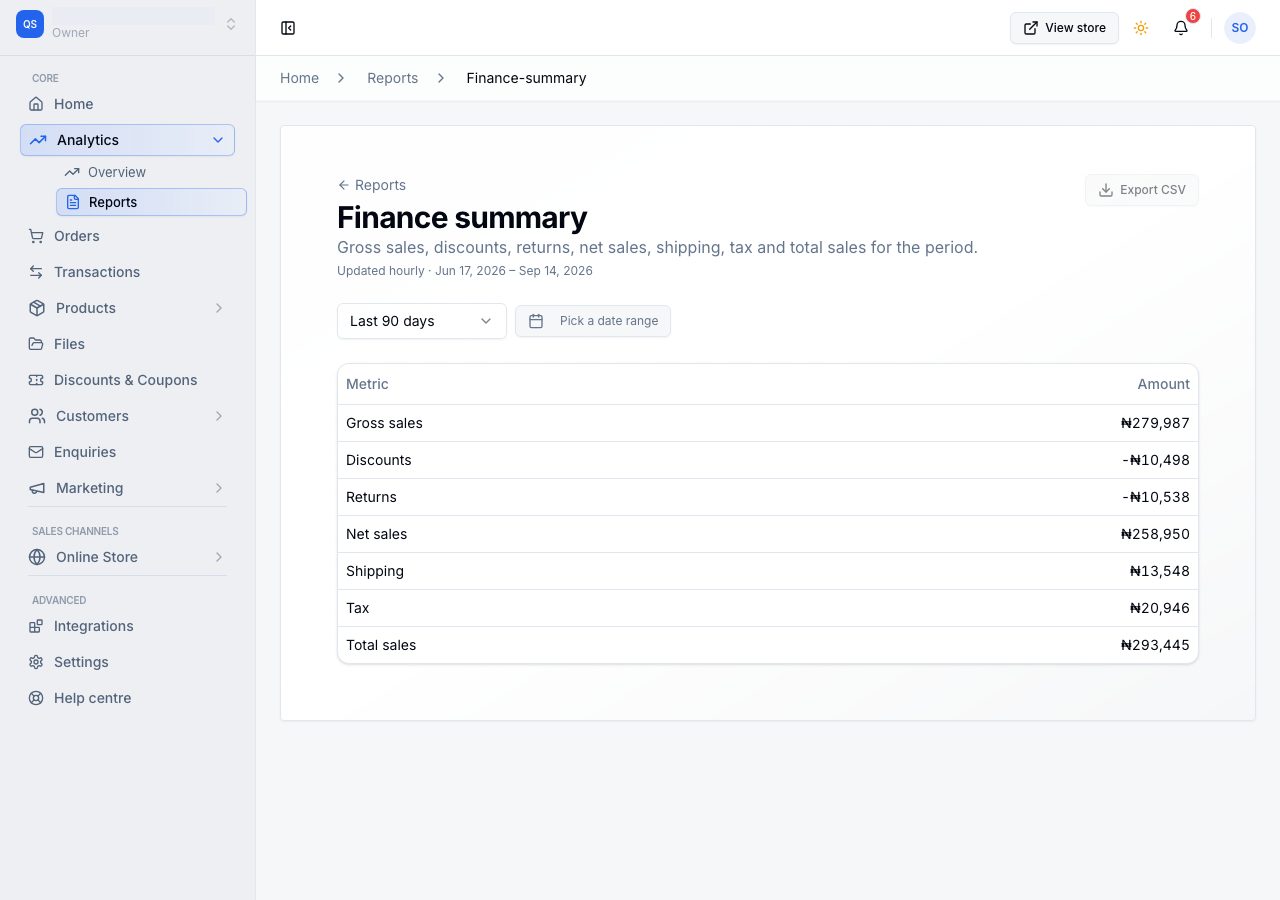
The finance summary is the one to reconcile against: gross sales, what came off it, and what was actually collected, in the order an accountant reads them.
What counts as revenue explains which orders are behind these figures and when each one lands.
If it does not work
- Export CSV will not press: your plan does not include exports. The tooltip names the plans that do, and Change your plan is the way there.
- A range is greyed out: it reaches further back than your plan's history window.
- A report is empty but you had sales: check the date range, then check that those orders are marked paid. An unpaid order is not a sale yet.
- The download did not start: your browser may have blocked it. Allow downloads for this site and press it again.
Email support@shoponent.com with your store name if anything here does not match what you see. We read and answer every message.