Available on every plan · Updated 14 September 2026
Also asked as: “where do I see my sales” · “how is my store doing” · “my revenue chart is empty” · “change the date range on analytics” · “what is average order value”
Analytics → Overview in the sidebar is the "how am I doing" page. Everything on it answers for one date range, which you pick once at the top and which every tab then obeys.
Analytics is on every plan.
Pick the range first
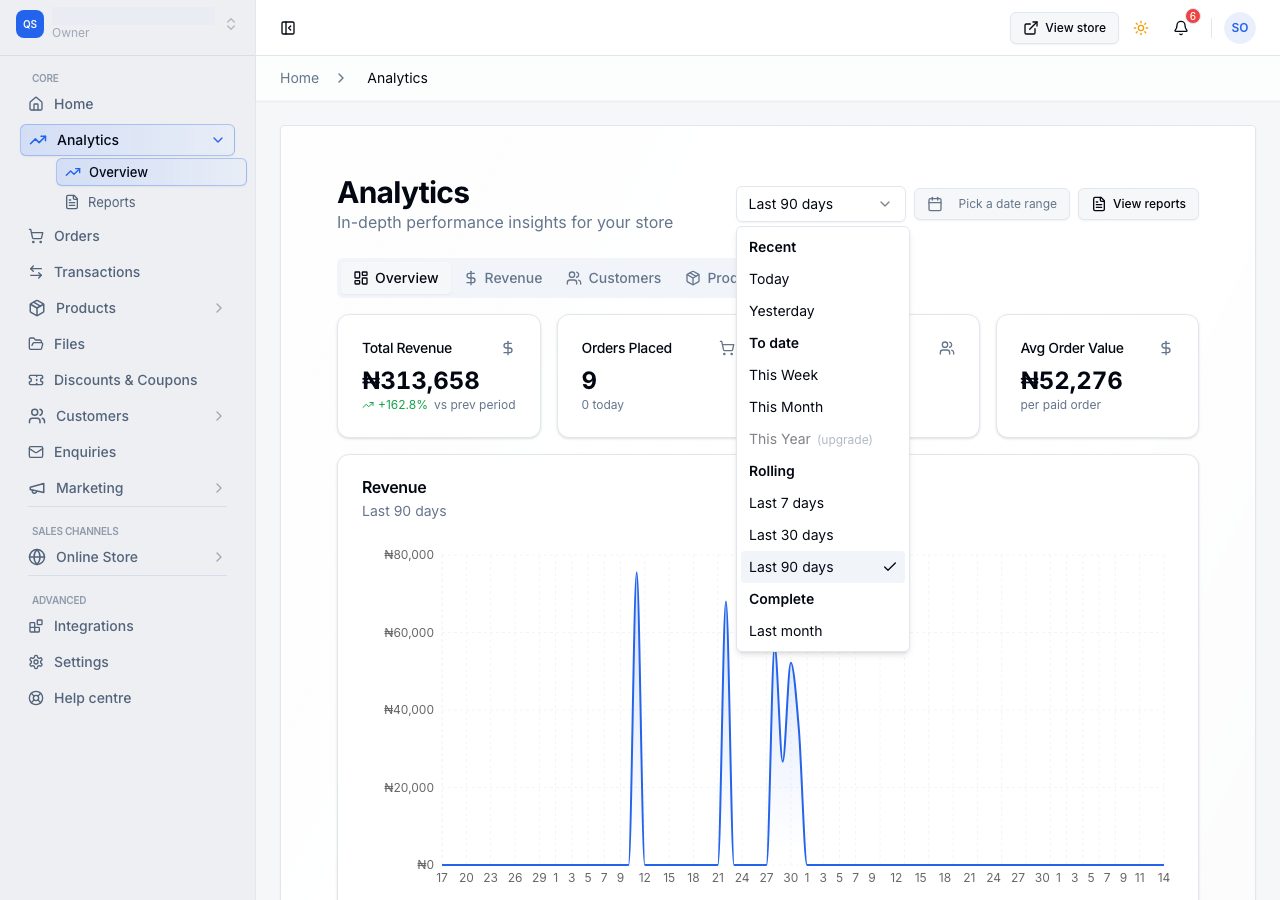
The menu beside the heading holds the ranges in four groups:
- Recent: Today and Yesterday.
- To date: This Week, This Month and This Year, each running from the start of that period up to now.
- Rolling: Last 7, 30 and 90 whole days, counting back from today.
- Complete: Last month, the previous calendar month in full, for when you are closing a period rather than watching one.
Pick a date range beside it takes any two dates instead. Days begin and end at midnight in your store's own time zone, so "Today" means your today.
A range your plan's history window cannot reach is greyed out and marked "(upgrade)"; see Reports, and what your plan includes.
The Overview tab
Four cards carry the headline, then the page fills in underneath.
- Total Revenue: what shoppers were charged on paid orders in the range, less anything you refunded in it. The small figure beneath compares it with the period before.
- Orders Placed: every order placed in the range, whether or not it has been paid for. Drafts are not counted.
- New Customers: shoppers whose first record in your store was created in the range.
- Avg Order Value: revenue divided by the paid orders, so it answers "what is a sale worth to me".
Below the cards: a revenue chart over the range, your top products, your most recent orders, a breakdown of order status, stock health, and customer activity.
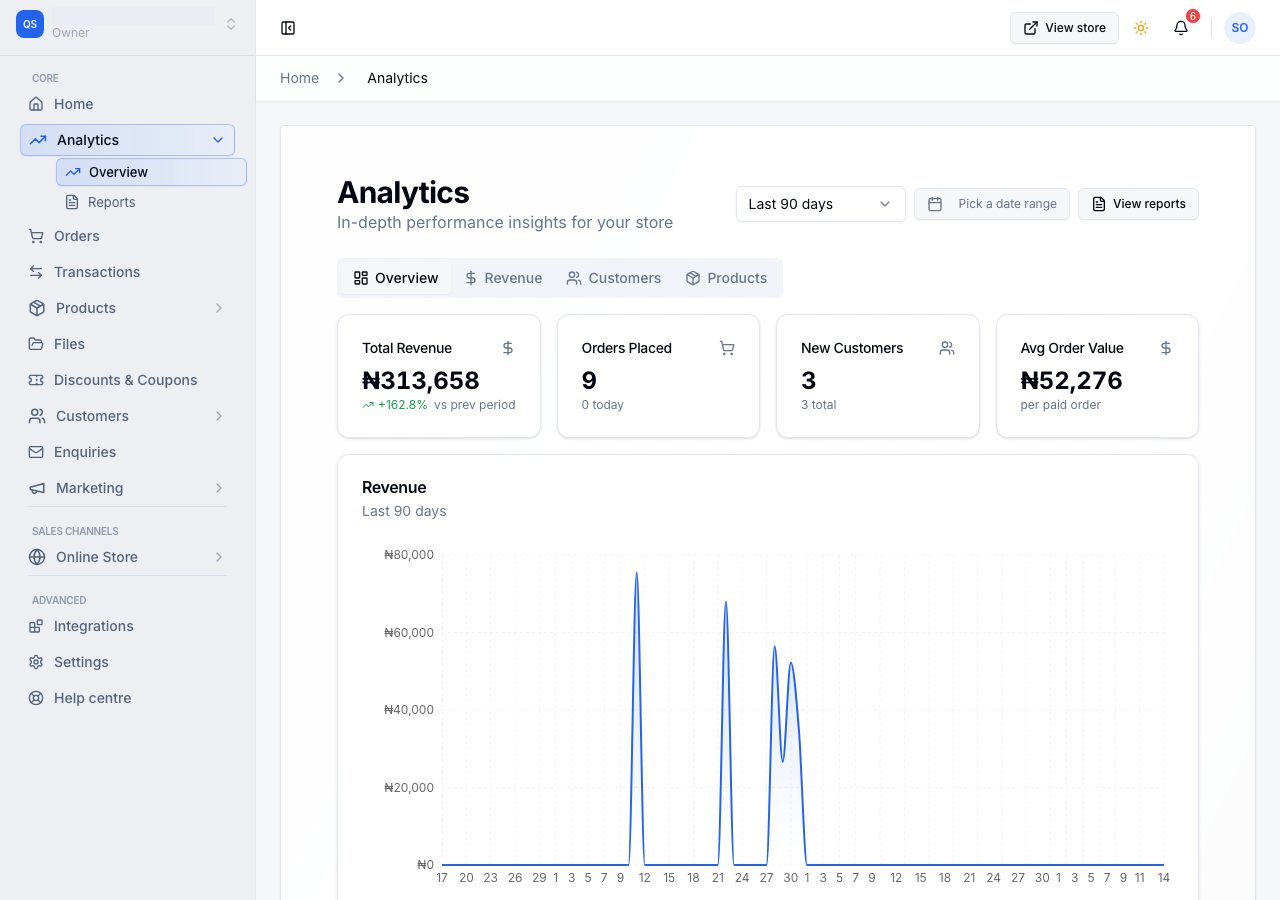
Two of those cards count different things on purpose, and it is the one thing worth knowing before you read any of this. Orders Placed counts every order placed. Everything with money in it counts orders paid. A day with five orders and two payments is not a contradiction. What counts as revenue has the whole rule.
The Revenue tab
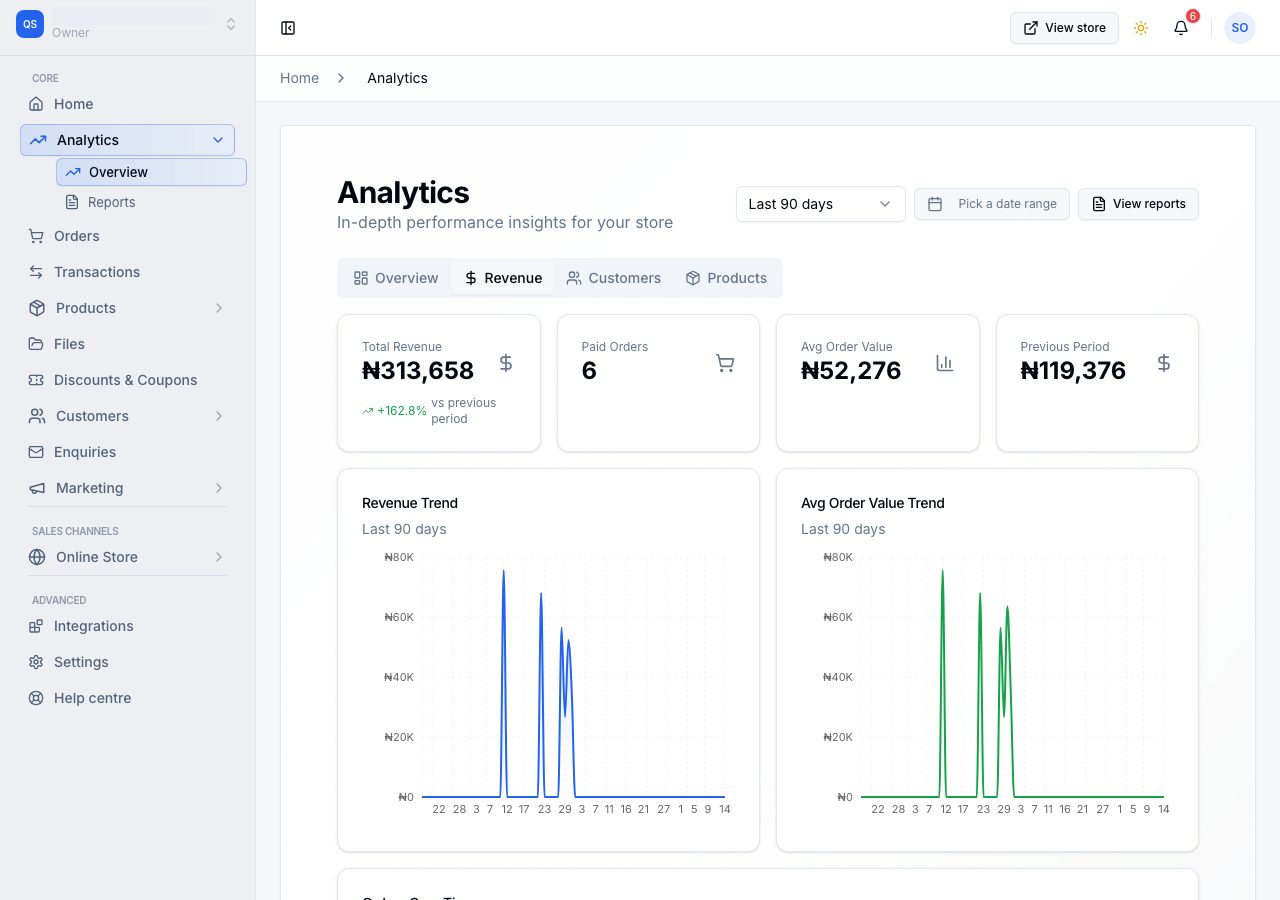
The same money, with the workings: revenue and average order value plotted over the range, orders over time, and the previous period beside the current one. Its order card is Paid Orders, because that is the count the money was divided by.
The Customers tab
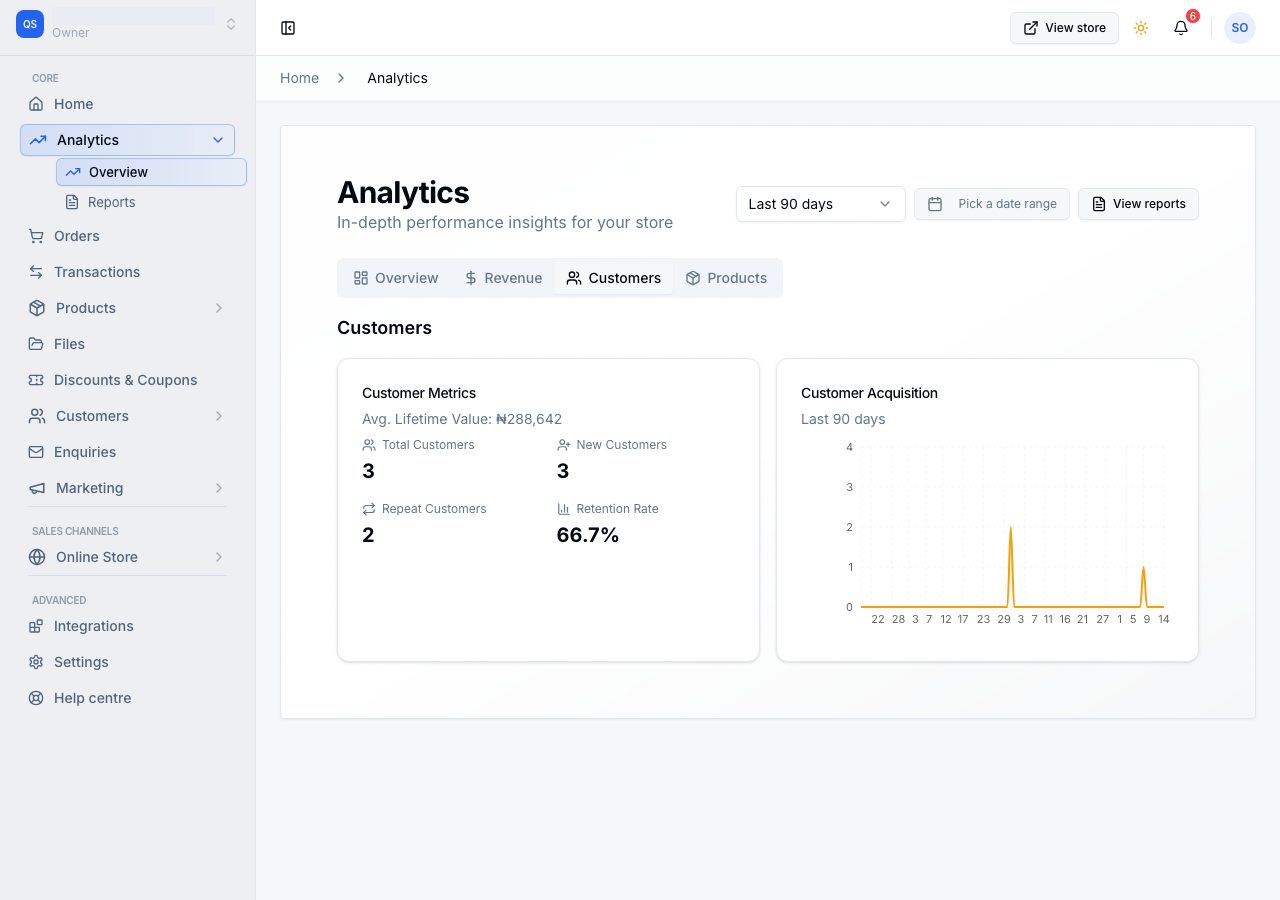
How many shoppers you have, how many are new in the range, how many came back, and what an average customer has spent with you across their whole history. The chart beside it is new customers over the range.
The Products tab
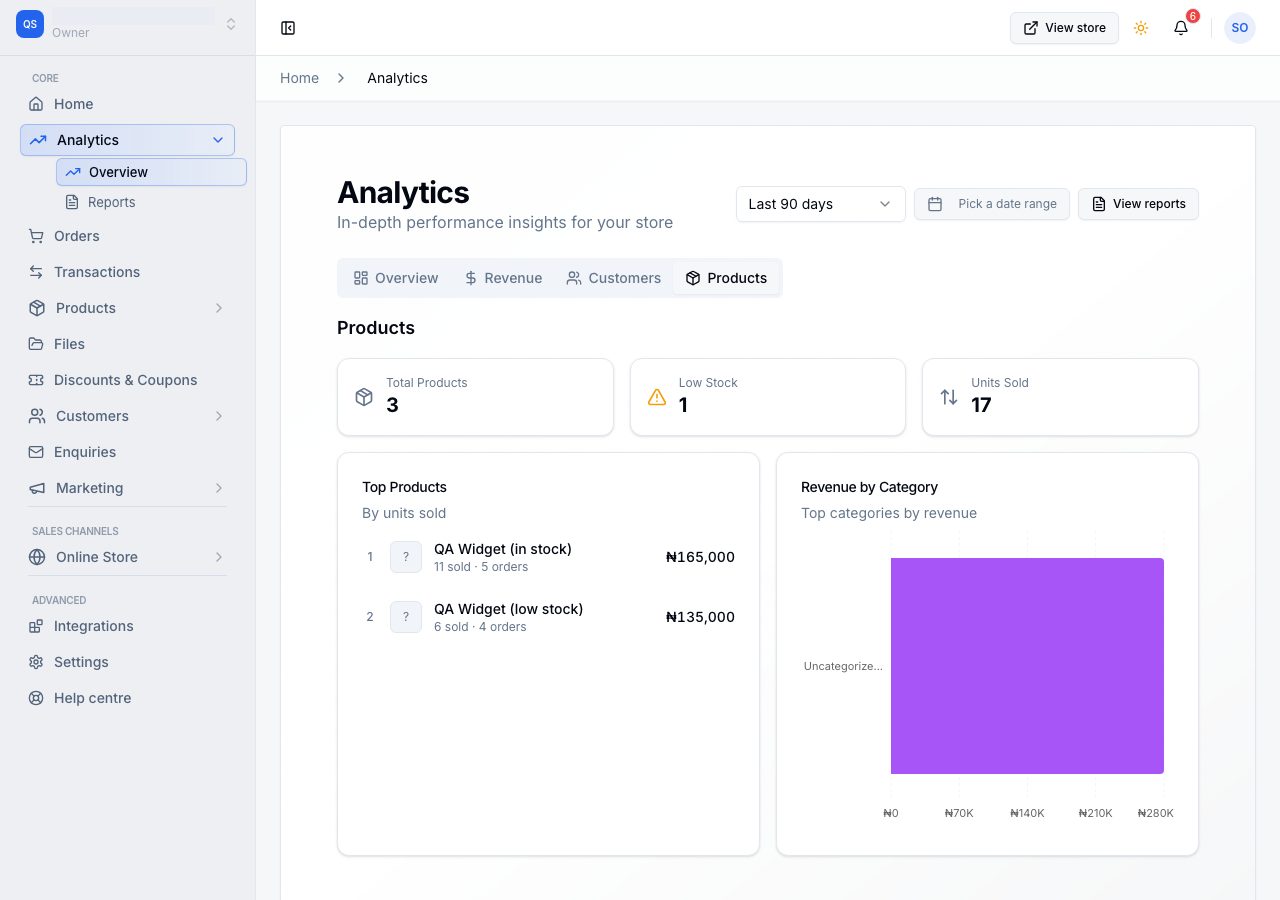
What sold: units sold in the range, your top products by units with the orders and money behind each, and revenue by category. The two counts beside them, total products and low stock, describe your catalogue as it stands now rather than the range, because stock is a fact about today.
When you want the detail
Analytics answers "how am I doing". For the row-by-row version, in a table you can take away as a spreadsheet, use View reports at the top of the page, or Analytics → Reports in the sidebar. See Reports, and what your plan includes.
If it does not work
- Everything reads zero: check the range first. A store whose orders were last month shows nothing at all under This Month.
- The revenue chart is flat but you have orders: the orders are probably not marked paid yet. Only paid orders carry money.
- A number here does not match a report: the reports are rebuilt hourly, while this page is worked out as you load it, so the last hour can differ. If the gap is older than that, tell us.
- You have more than one location and everything looks low: stores with two or more locations get a location filter beside the date range, and it scopes the whole page to orders fulfilled from that one. Set it back to All Locations.
Email support@shoponent.com with your store name if anything here does not match what you see. We read and answer every message.